

Indian Rupee to average 93.1 against US Dollar in FY27 as current account deficit eases: Ind-Ra
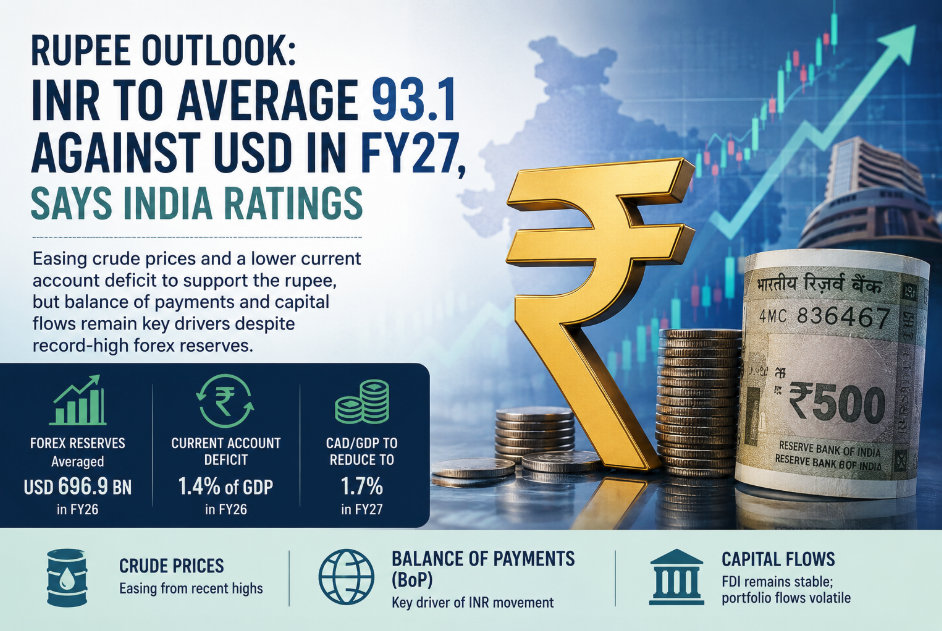
India Ratings expects the rupee to average 93.1 against the US dollar in FY27, supported by easing crude prices and a lower current account deficit.
While a current account surplus implies an appreciated rupee, it also implies that the economy is exporting domestic savings, through the following linkage between domestic and external sectors. (AI Image)
India Ratings and Research (Ind-Ra) highlights India’s foreign exchange reserves averaged USD696.9 billion in FY26, rising from USD199.2 billion in FY07. Despite the high reserves, the Indian Rupee (INR) depreciated against the US dollar (USD) to an average of 88.4 due to a higher current account deficit (CAD) of 1.4% in FY26 (FY25: 0.6%) and reduced capital flows, among others – thereby impacting domestic inflation, GDP growth and other economic indicators. INR further depreciated to its record low level of nearly 96 in May 2026, following the west asia crisis and increase in global crude prices. “We expect CAD/GDP to reduce to 1.7% and INR/USD to average at 93.1 in FY27 following the ease in crude prices due to the fragile resolution of the west asia crisis, compared to our May 2026 forecast of 2.6% and 94.37, respectively,” says Megha Arora, Economist and Director, Ind-Ra.
INR responds to balance of payments (BoP), i.e., aggregate position of current and capital account. Generally, a higher BoP surplus leads to a stronger rupee and vice versa. However, this relationship does not always hold, as the correlation between change in INR and current account based on 80 quarters (during 1QFY07-4QFY26) is weak at negative 0.08, while a moderate correlation of negative 0.35 has been found between capital account balance and change in INR. A strong correlation does not exist as there are several other factors that explain rupee movement such as present and future economic growth and inflation, geopolitical factors, crude price movement, and US Fed policy and interest rate movement (present and future), among others. Despite this low and moderate correlation, both current and capital account balance are considered as important signalling mechanisms for currency movement. Thus, it becomes imperative to study BoP.
Current Account: India’s current account mostly remains in deficit due to its high trade deficit, which services surplus and remittances together are unable to offset. During FY07-FY26, current account was in surplus only in eight out of the 80 quarters (4QFY07, 4QFY20, 1QFY21, 2QFY21, 1QFY22, 4QFY24, 4QFY25, and 4QFY26). The surplus in 4QFY20 (USD0.6 billion, 0.1% of GDP) was witnessed post a gap of 51 quarters after 4QFY07 (USD4.2 billion).
The current account encompasses merchandise trade and invisibles (services trade and remittances, among others).
Merchandise Trade: India’s merchandise trade is perpetually in deficit, as the country is a net commodity importer, particularly of oil and gold. Thus, global crude and gold prices impact domestic inflation, production and corporate profitability, and fiscal deficit, among others. During FY12-FY13, India’s trade deficit increased due to high commodity prices. A similar level of trade deficit was witnessed in FY19, while it further increased in FY23 and FY26. However, a sustained surplus in invisibles (services account coupled with remittances) provides some support to trade deficit and INR.
Invisibles Trade: During FY07-FY26, there were six out of 20 years when invisibles trade growth contracted (FY10, FY11, FY13, FY16, FY17, and FY21). This contraction was mainly due to a decline in services trade, given its high share of 69.4% in invisibles and rising outflow of income. Transfers account for a share of 46.0% of invisibles, while net income perennially remains negative. For FY26, net invisibles trade has been estimated to be USD312 billion, 18.2% higher than USD264 billion in the previous year.
Services Trade: During FY07-FY26, services trade was continuously recorded in surplus, software exports being a major component. There were three years – FY10, FY16, and FY17, when surplus reduced compared to their respective previous years for varied reasons – due to a decline in business services and financial services (in FY10), multiple sectors (in FY16), and software exports and financial services (in FY17).
Transfers or Remittances: Transfers or remittances are another big component of invisibles, averaging USD72.2 billion during FY07-FY26.
According to the World Bank, India was the biggest recipient of remittances in the world in 2024 and received an estimated USD129 billion (nearly 19% of the total remittances).
While a current account surplus implies an appreciated rupee, it also implies that the economy is exporting domestic savings, through the following linkage between domestic and external sectors.
Savings – Investments = Current Account Balance
On the other hand, CAD implies the economy is importing external savings to finance domestic investment. Thus, current account balance impacts macro-economic variables such as exchange rate, inflation and thus, GDP growth. For a capital-starved economy such as India that requires high investment, CAD could be a better option provided it remains within a manageable limit of around 2.5% of GDP.
Capital Account: During FY07-FY26, the capital account mostly remained in surplus except for six instances (FY09, FY12, FY19, FY23, FY25, and FY26), when inflows in the capital account fell short of covering CAD. Net foreign direct investments (FDIs) were a major and most stable source of inflows in the capital account during FY16-FY23, due to liberation of various sectoral FDI norms in India. During FY07-FY20, it remained the largest source of inflow for 11 out of the 20 years. For the same period, net FDI averaged USD23.7 billion. However, there is a downtrend in recent years due to multiple reasons including US-India tariff uncertainty in FY25, west asia crisis and INR depreciation, and India’s limited capability in AI and semiconductors, etc.
On the other hand, portfolio investments remained variable during FY07-FY26. Compared to all inflows in the capital account, they were highest only in four of the 20 years (FY10, FY11, FY15, and FY24). Their inflows and outflows depend on multiple domestic and external factors including economic growth prospects, capital market conditions, and global geopolitical developments, making such investments highly volatile. In the event of an actual or perceived risk, these investments exit India and return to USD denominated assets, considered to be safe havens. This was visible in FY09 (following 2008 financial crisis), FY16 (global commodity slump, lack of domestic reforms, and low corporate earnings), FY19 (comparatively higher crude price), FY22 (Russia-Ukraine conflict, high crude price, and increased US Fed rate), and FY23 and FY26 (west asia crisis, high crude price, and increased US Fed bond yields), when India recorded net foreign portfolio inflows (FPI) outflows. Net portfolio inflows averaged USD12.3 billion as against net FDI average of USD23.7 billion during FY07-FY26.
A BoP surplus, i.e. a higher capital account balance that covers CAD or surplus both in capital and current accounts generally adds to India’s foreign exchange reserves and results in a stronger rupee, though the latter may not always happen for the reasons mentioned earlier. The past two years, FY25 and FY26, witnessed the lowest net FDI since FY07, while FY26’s net portfolio investment was lowest since FY07. Thus, the rupee recorded its worst annual average of around 84.6 (FY25) and 88.4 (FY26) against the USD.
Key Economic Indicators
Industrial Production to Improve in June 2026: Ind-Ra expects IIP growth to improve to 5.7% in June 2026, as the base effect will help in maintaining the growth momentum. The decline in crude prices due to the fragile resolution of the West Asia crisis is also likely to support growth momentum in June 2026. IIP growth (based on the new 2022-23 series) marginally improved to 5.1% yoy (Ind-Ra forecast: around 5.5%; April 2026: 4.9%) due to high growth in the electricity and gas sector at 9.9% (4.6%), followed by manufacturing and the recently introduced water supply category. The manufacturing sector, which accounts for over three-fourths of the IIP index, reported a slowdown at 5.5% yoy in May 2026 (April 2026: 6.1%). Mining & quarrying continued to contract, though at a slower pace of negative 1.6% (negative 3.8%). Within electricity & gas supply, growth was driven by electricity, while the impact of West Asia crisis continued to be visible in gas supply contraction, albeit at a reduced pace. Of the six use-based segments, capital goods maintained its lead with highest growth of 12.9% yoy in May 2026 (April 2026: 12.0%), followed by infrastructure/construction goods – this suggests investment activities in the economy are continuing.
Marginal Uptick in Services Sector in May 2026: The services sector activity, as measured by the Purchasing Managers’ Index (PMI), improved to 59.8 in May 2026, the same level as November 2025. The sector remains in an expansionary mode (gauged by PMI of above 50) since at least August 2021.
Retail Inflation to Increase, Wholesale Inflation to Remain Stable: Ind-Ra believes the headline inflation is likely to rise to 4.5% in June 2026, surpassing the Reserve Bank of India’s (RBI) benchmark inflation rate of 4%, but remain within its upper tolerance band of 6%. Wholesale Price Index (WPI) might remain around the same level. In line with Ind-Ra’s expectation, the retail inflation inched closer to 4%, recording a 15-month high of 3.93% yoy in May 2026 (Ind-Ra forecast: 3.8%; April 2026: 3.48%) due to high food, transport, and gold and silver prices. While the overall fuel inflation remained muted due to the base effect, the impact of petrol and diesel price hike was visible in transport prices. On the other hand, WPI inflation surged to 9.68% in May 2026 (Ind-Ra forecast: around 9.0%; April 2026: 8.26%; March 2026: 3.98%) due to a broad-based increase seen across segments, though fuel & power contributed substantially, due to firming of mineral oils and global crude prices because of the West Asia conflict. The impact of high global crude prices was evident in the manufactured products as well. Food prices have been on an increasing trend since November 2025 and reached a 16-month high at 3.6% in May 2026. This was due to the base effect. Along with May data, the Office of the Economic Adviser released WPI data on the revised base year of 2022-23 from 2011-12 and introduced Output Producer Price Index. Geopolitical tensions and El Nino conditions remain upside risks to inflation. Though crude prices in early July 2026 eased following the news of agreement between Iran and the US, it will take time for crude prices to move to less than USD70/bbl (pre-war).
May 2026 Trade Deficit (goods and services): Goods trade deficit marginally declined to USD28.2 billion in May 2026 (April 2026: USD28.4 billion) due to higher exports. However, services trade surplus declined to a nine-month low of USD15.7 billion (USD18.6 billion). This has resulted in trade deficit (goods and services) increasing to a four-month high of USD12.5 billion (USD9.6 billion).
Risk-free Cost of Borrowing Increased in May 2026: The risk-free cost of borrowing for the union government for a 10-year tenor increased to a monthly average of 7.04% in May 2026 (April 2026: 6.96%). As a result, the spread between G-sec yield and repo rate increased to 179bp (171bp), led by a continued monetary cycle and the government’s increased borrowing demand.
Monetary Policy to Focus on Liquidity and Strengthening of Currency: As Ind-Ra had expected, the RBI held repo rate steady in its June 2026 Monetary Policy Committee meeting, and measures were announced to improve capital flows in the economy. During FY27, Ind-Ra expects the RBI to focus on ensuring sufficient liquidity in the system to keep a lid on domestic rates. We expect the RBI to hold rates in its August 2026 Monetary Policy review, where the key indicators to monitor include currency and liquidity, besides crude oil price.





4 thoughts on “Indian Rupee to average 93.1 against US Dollar in FY27 as current account deficit eases: Ind-Ra”