
India’s office market holds firm in H1 2026; GCCs account for over 41% of leasing: JLL
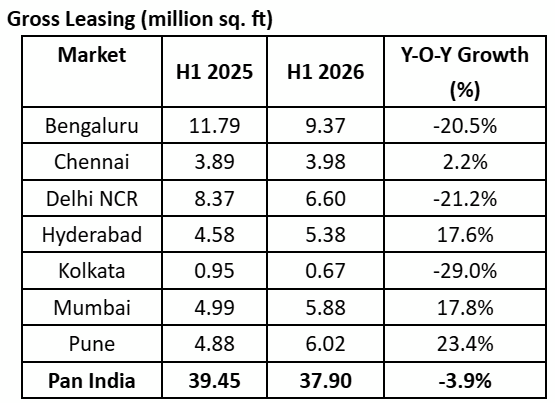
Despite a modest 3.9% year-on-year decline in H1 2026 leasing, Global Capability Centres accounted for 41.7% of demand, while record net absorption and a five-year low vacancy underscore the resilience of India’s office market.
At a city-level, gross leasing volumes in Q2 2026 (April-June) continued to be driven by Bengaluru with a share of 24.6%, followed by Delhi NCR with 21.6%, Pune with 17.7% and Chennai with 13.9% shares, respectively. (Image: Freepik)
India’ s office market maturely evolves as occupiers’ global playbooks call for a calibrated approach with business transformations driven by artificial intelligence (AI) and geopolitical shifts. Businesses are not cutting back on India but are cautiously carrying on with their commitments to the market by right-sizing portfolios and aligning headcount expectations with their future plans in Q2 2026. This has led to a sluggish demand scenario with gross leasing of 16.45 million sq. ft. in Q2 (April-June). Uncertainty around business conditions led to some deals slipping beyond the quarter contributing to the downfall as occupiers awaited better decision-making windows. Nonetheless, H1 2026 (January-June) registers the second-highest H1 period ever, following H1 2025 with leasing activity at 37.9 million sq. ft.
India’s standing as the largest GCC ecosystem globally remains unmatched and GCCs continue to grow at record pace in the country. In H1 2026, GCCs have already leased 15.8 million sq. ft, on track to match and potentially surpass last year’s record levels, given ongoing space discussions and new entrants planning on setting up their centres in the country during the year.
“There’s a fundamental transformation we are witnessing in India’s office market; and Global Capability Centres (GCCs) seem to be driving this. With 41.7% share of leasing activity and on track to surpass 2025’s record with 15.8 million sq. ft already leased in H1 2026, we have seen a strategic shift in the sector. As GCCs continue to leverage our skilled talent in AI, data science, and digital engineering to build products, analytics platforms, and drive innovation, we are witnessing unprecedented expansion from BFSI and manufacturing sectors, alongside new entrants from Retail, Logistics, Infrastructure, and Aerospace domains. Alongside this GCC momentum, flex operators have emerged as a major force, accounting for 28.4% of Q2 leasing and reaching a record 10.23 million sq. ft in H1 2026, reflecting the growing appetite for agile workspace solutions among both domestic and global occupiers,” said Radha Dhir, Chief Executive Officer, India, JLL.
“While 2026 represents a strategic pivot year as firms optimise portfolios, the structural growth trajectory remains intact, we are confident India will hit the century milestone in leasing volumes over the next two years, cementing its position as the epicentre of global business transformation,” she added.
Bengaluru maintains dominance with quarter of national leasing; Delhi NCR, Pune follow:
At a city-level, gross leasing volumes in Q2 2026 (April-June) continued to be driven by Bengaluru with a share of 24.6%, followed by Delhi NCR with 21.6%, Pune with 17.7% and Chennai with 13.9% shares, respectively. On a H1 basis, Bengaluru remained the biggest contributor with a 24.7% share, followed by Delhi NCR, Pune, Mumbai and Hyderabad in that order.
Source: Real Estate Intelligence Service (REIS), JLL Research
Global firms lead the charge in H1 2026, but domestic firms driven by flex have improved their share of the leasing volumes
On an absolute basis, Flex has now leased 10.23 million sq. ft in H1 2026 across the top seven cities, which is a record high for any H1 periods previously for this segment.
GCCs displayed an accelerating momentum y-o-y in H1 2026, with activity up by 14.2% and their share in the H1 leasing volumes at 41.7%, underscoring their continued dominant role in driving office space demand in India. Within GCCs, Tech and BFSI dominated the leasing activity followed by manufacturing segment during the first half of the year. Overall, global-headquartered firms continued to command a lion’s share of the India office leasing landscape with a 55.2% share in H1 2026, slightly lower than their previous year average, with the global uncertainties more on display in the second quarter of the year.
Domestic occupier activity was driven by indigenous flex operators who held a dominant 57.8% share of the total space leased by domestic firms in H1 2026. Domestic tech firms are re-engineering their service offerings to drive upstream value creation with prolific use of AI to create customised, long-term and strategic outcomes for their clients. They are growing at a slower pace in terms of leasing activity in H1 2026 compared to the same period last year.
Net absorption for H1 2026 at a record for first half periods across all years
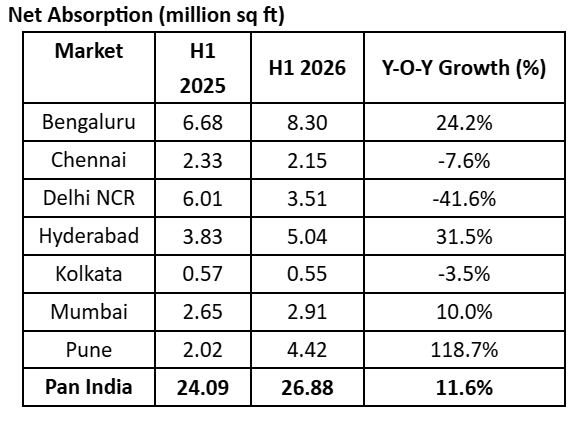
India’s net absorption in H1 2026 rose to 26.9 million sq. ft, up by 11.6% y-o-y and the highest ever compared to all previous first half periods. This performance was led by Bengaluru with a 30.9% share with strong space take-up in quality projects across the core markets in the city. Bengaluru was followed by Hyderabad with an 18.8% share with Pune and Delhi NCR with 16.4% and 13.0% shares, respectively. On a quarterly basis, Bengaluru led with a 25.5% share followed closely by Pune with 24.3% and Delhi NCR following with a 15.4% share.
Source: Real Estate Intelligence Service (REIS), JLL Research
Vacancy drops to five-year low of 14.5% with Mumbai and Delhi NCR recording lowest levels in over 15 years
With new completions at 22.9 million sq. ft in H1 2026, down by 9.3% y-o-y and net absorption hitting a record high during the same period, Pan-India vacancy across the top seven cities fell its lowest in five years at 14.5%, down by 160 bps y-o-y. The core sub-markets across cities continued to witness single digit vacancies, factoring in current occupancies and deals which are nearing closures. In fact, vacancy remains at a historic low for Mumbai over the last 16 years and in Delhi NCR over the past fifteen. The current vacancy in Pune is also lowest in last 6 quarters and in case of Hyderabad with robust space take-up has now fallen to a two-year low. For Bengaluru and Chennai vacancy levels are down y-o-y, while vacancy levels have dropped the most y-o-y in Hyderabad followed by Delhi NCR and Pune, indicating an impending shortage of vacancy in high-quality buildings across key office corridors in all cities.
Structural tailwinds position India for multi-year office growth runway despite near-term global headwinds
While near-term leasing volumes reflect measured caution driven by geopolitical uncertainty and AI-led business transformation, India’s structural advantages, exceptional talent pool, a thriving innovation ecosystem, and compelling cost arbitrage, position the country for sustained office market growth. The fundamental drivers remain robust: GCCs are creating product ownership roles that fuel continued headcount expansion and real estate footprint growth, while tightening vacancy rates within core assets and submarkets signal strong appetite for business expansion.
Occupancies are rising across existing portfolios and cap space will increasingly become constrained driving new demand. While near term hurdles such as cautious decision making and portfolio rightsizing may create headwinds, there is a healthy pipeline of institutional backed quality supply that is poised to meet this demand. More importantly, India’s standing as the global business destination of choice for innovation and transformation remains unchallenged. Along with the momentum created over last couple of years, these structural tailwinds are expected to ensure leasing levels for 2026 remain close to 2025’s historic achievements and create a multi-year growth trajectory for India’s office market.





1 thought on “India’s office market holds firm in H1 2026; GCCs account for over 41% of leasing: JLL”