

Where India Inc Put Its Money in FY26: Winners, laggards and emerging trends
Government-led capex, lower interest rates and resilient domestic demand drive fresh investments in infrastructure, capital goods, retail and select manufacturing sectors despite global trade uncertainties.

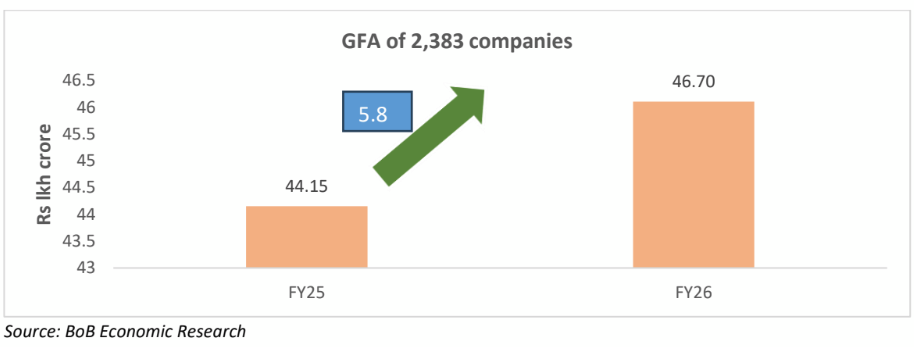
For a set of 2,383 companies, cumulative gross fixed assets (including capital work in progress) increased by 5.8% from Rs 44.15 lakh crore to Rs 46.70 lakh crore. (AI Image)
Investment in capital by companies is a leading indicator of overall investment in the country. FY26 was a tough one in terms of taking decisions on investment due to the tariff issue which created considerable uncertainty with the rates being altered at times. Specific industries which were export oriented did hence witness headwinds. On the other hand a well poised domestic economy aided by a capital push by the centre as well as incentives to consumers to spend did open the door for fresh doses of investment by companies. Also, there was an aggressive lowering of the repo rate starting in February 2025 which cumulated to 125 bps till March 2026. Against this background, it would be of interest to see which industries did focus on capital formation this year. Alongside, there was an uptick in growth in bank credit too which is a quick indicator of economic activity in the country which is used for both investment and working capital purposes.
The macro picture
For a set of 2,383 companies, cumulative gross fixed assets (including capital work in progress) increased by 5.8% from Rs 44.15 lakh crore to Rs 46.70 lakh crore. In FY25, growth was 7.4%.
There was however differences in growth in assets across different sectors. The table below gives information on the sectors which had growth of above 10% in FY26. These companies accounted for around 10% of total GFA of the sample.
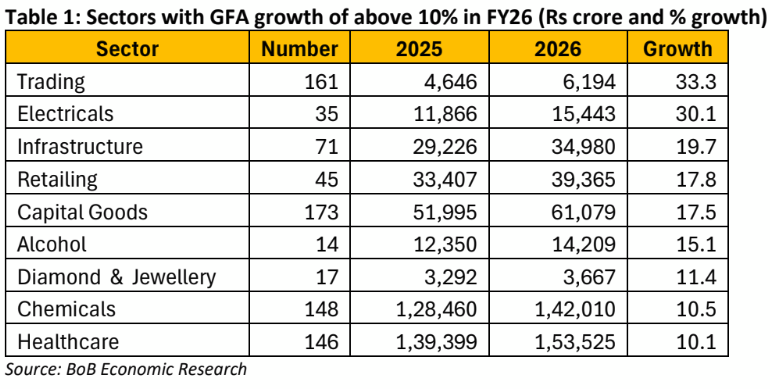
For these 810 companies growth was 13.5%. As can be seen, both infrastructure and capital goods have witnessed a good increase in GFA of above 15%. Here the front end spending of the government on capex would be one of the major contributory factors to this expansion. Retail has been a booming sector with several companies expanding on their physical contact points by setting up multitude stores across the country. Trading too has been up as this was of the driving forces in growth as the services sector too has done very well this year. The growth in diamonds and jewellery is interesting as this is one sector which was to be affected by the tariff issue last year. Quite clearly the sector has managed to hold on and also look at expansion though admittedly the sample size is small.
Growth in credit to these sectors has been as follows for FY26: trading (16.2%), infrastructure (9.5%), retailing (11.5%), capital goods (32.2%), alcohol (13.1%), diamonds and jewellery (41.4%), chemicals (14.9%) and healthcare (17.9%). (These industries have been broadly mapped with the RBI classification of credit across sectors where the coverage could be different). Clearly the higher growth in assets has been associated with steady growth in credit too.
The table below gives the growth in GFA for a set of 12 sectors covering 825 companies which had growth of above 5% but lower than 10%. These companies accounted for around 51% of total GFA and witnessed an increase of 7.1%.
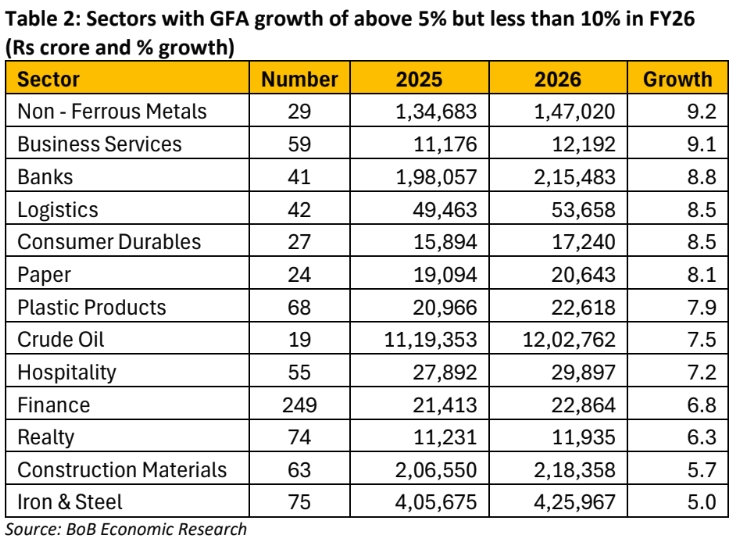
In terms of sheer size, crude oil is the largest sector when it comes to GFA; and steel is the third largest industry. Here it can be seen that growth has been impressive for crude oil as growth has been maintained on top of 7.1% witnessed last year. Iron and steel registered flat growth of 5% in both the years. As there has been high infra spending by the government, it can be surmised that the steel industry has spare capacity given the demand conditions and hence has been conservative in investment.
The higher growth of 8.5% in durables is indicative of the companies building up capacity to meet the growing demand on the back of the tax cuts invoked by the government as well as the income tax benefits bestowed in the budget. Growth in GFA for logistics is also encouraging as it is indicative of building capacity for meeting future demand with the spread of e-commerce adding the icing. The uptick seen in paper and other products is also linked to the e-commerce boom.
Construction material has witnessed growth of 5.7% which is good as it comes over the back of 27.4% witnessed in FY25. The two activities that have contributed to this demand are housing and roads. The growth in case of realty is more of a recovery as there was a decline of 5.6% in FY25. It does appear that the industry is back on track in FY26.
The table below gives the industries which have witnessed low growth of less than 5% in FY26. These 748 companies accounted for the balance 39% of GFA.
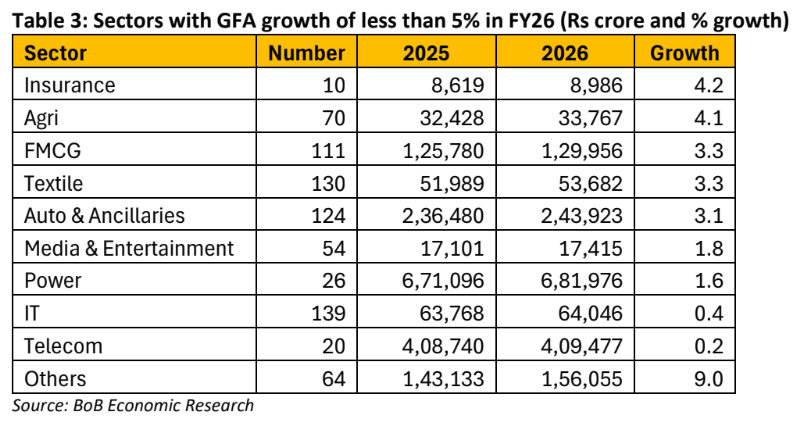
Here the two large sectors are power and telecom. In FY26 there has been limited investment undertaken by them given demand conditions. Investment by the power sector is more in renewable segment than conventional energy. The agricultural products sector was affected by the export segment being under the umbrella of tariffs imposed by USA; and hence was cautious. The same holds for textiles. FMCG continues to be cautious as growth going by IIP showed virtual flat 0.04% growth in FY26. Clearly the demand conditions and spare capacity do not warrant further investment.
The auto sector too has been cautious with demand still being concentrated in the premium segment and the entry level had just started picking up. This should change in FY27. Besides there was a base effect with GFA increasing by 25% in FY25.
Concluding remarks
The balance sheets of this sample of 2383 companies do show that investment has remained steady with growth of 5.8% in FY26. It would be interesting to see if the last set of industries which had lower than 5% growth do pick up in FY27 given the rather uncertain economic environment.