
Housing demand regains momentum in Q3 as sales rise 3%, launches up 18%: Anarock
The average residential property price across the top 7 cities collectively witnessed single-digit annual growth of 7% - from INR 9,105 per sq ft in Q3 2025 to INR 9,714 per sq ft in Q3 2026. (AI Image)
Neither geopolitical uncertainty nor other economic pressures could stop India’s residential market from regaining momentum in Q3 2026. Housing sales picked up from a tepid Q2, driven by resilient end-user demand, though rising costs and uneven demand across markets continued to keep growth range bound.
Anarock Research’s Q3 2026 data reveals that housing sales across the top 7 cities increased by 3% annually, with approx. 1,00,220 units sold in Q3 against 97,080 units back in Q3 2025. The total sales value in this period also rose by 2% – from INR 1.52 lakh Cr in Q3 2025 to approx. INR 1.55 lakh Cr in Q3 2026.
Anuj Puri, Chairman – ANAROCK Group, says, “Among the top cities, MMR recorded the highest sales of approx. 31,750 units, followed by Bengaluru with approx. 16,670 units. Together, these two cities accounted for 48% of the total sales across the top 7 cities in Q3 2026. At 15%, Hyderabad saw the highest yearly jump in housing sales, followed by Bengaluru with 12% Y-o-Y rise, and MMR with a 5% gain. All other top cities individually recorded a dip in sales on an annual basis.”
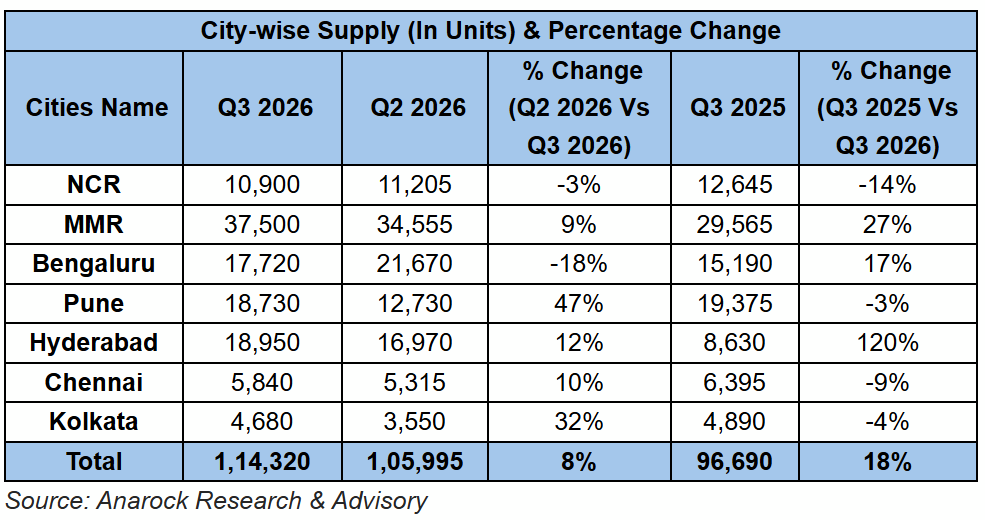
Meanwhile, new housing supply in the top 7 cities rose 18%. City-wise, MMR topped new supply with approx. 37,500 units launched in the quarter, followed by Hyderabad with approx. 18,950 units. Interestingly, while most cities saw new supply decline annually, Hyderabad, MMR and Bengaluru saw new supply increase – by 120%, 27% and 17%, respectively.
In terms of budget segments, the INR 80 Lakh to INR 1.5 Cr category comprised the highest new supply share of 34%, followed by the INR 1.5 Cr – INR 2.5 Cr budget segment with a 24% share. The INR 40– 80 lakh budget segment contributed a 17% share of the total new supply during the quarter, while the <INR 40 lakh category saw the lowest share at 14%.
Available housing inventory rose 12% annually in the top 7 cities – from 5,61,760+ units by Q3 2025-end to 6,30,590+ units by Q3 2026-end. Average residential prices in the top cities collectively rose by a mere 7% in Q3 2026 against Q3 2025. NCR saw highest (12%) annual growth, followed by Bengaluru with an 8% yearly rise.
“The upcoming festive season is expected to boost residential demand, building on the momentum seen in Q3,” says Puri. “While buyers will likely stay selective due to higher prices and increasing affordability concerns, the combination of festive sentiment, stable borrowing costs and a healthy new launch pipeline should support sales. Demand is resilient, but we expect more measured growth – well-priced, well-located projects that align with the current demand profile will outperform others this festive season.”
New Supply Overview
The top 7 cities saw approx. 1,14,320 units launched in Q3 2026, against 96,690 units in Q3 2025 – an 18% annual increase. On a quarterly basis, new launches rose 8%. In Q2 2026, approx. 1,05,995 units were launched across the top 7 cities.
The key cities contributing to new supply in Q3 2026 were MMR (Mumbai Metropolitan Region), Pune, Bengaluru, and Hyderabad, which together accounted for 81% of the total addition.
- MMR saw approx. 37,500 units launched in Q3 2026 – a 27% annual increase and a 9% quarterly rise. Over 51% of the new supply during the quarter was added in the <INR 80 lakh budget segment.
- Hyderabad added approx. 18,950 units in Q3 2026, compared to 8,630 units in Q3 2025 – a whopping 120% yearly increase and a 12% quarterly jump. A whopping 97% of the new supply was added in the premium, luxury, and ultra-luxury segments (priced upward of INR 80 lakh).
- Pune added approx. 18,730 units in Q3 2026, witnessing a yearly drop of 3%, and a 47% quarterly increase in new supply. Over 79% of the new supply was added in the INR 40 lakh – INR 1.5 Cr budget segment.
- Bengaluru added approx. 17,720 units in Q3 2026 – a yearly increase of 17%, and a 18% quarterly drop. Approx. 81% of the new supply was added in the INR 80 lakh – INR 2.5 Cr budget segment.
- NCR saw a 14% yearly drop in new launches with approx. 10,900 units added in Q3 2026. On a quarterly basis, it saw a 3% decline compared to Q2 2026. Notably, over 34% of the new supply in the quarter was added in the >INR 2.5 Cr budget segment.
- Chennai added approx. 5,840 units in Q3 2026, seeing a 9% yearly decline but a 10% quarterly rise. Over 83% of the new supply was added in the INR 40 lakh – INR 1.5 Cr. price segment
- Kolkata added approx. 4,680 units in Q3 2026, a 4% annual decline and a significant 32% rise over the previous quarter. Approx. 79% of the new supply was added in the segments priced within INR 40 lakh to INR 1.5 Cr.
Housing Sales Overview
Approx. 1,00,220 units were sold in Q3 2026 – a yearly rise of 3% and a quarterly increase of 10%. NCR, MMR, Bengaluru and Pune together accounted for 78% of the sales in the quarter.
- MMR recorded the highest sales among the top 7 cities in Q3 2026, with approx. 31,750 units sold – a quarterly increase of 11% and a 5% yearly rise.
- Bengaluru sold approx. 16,670 units in Q3 2026, a quarterly and yearly increase of 9% and 12%, respectively.
- Pune saw approx. 15,690 units sold in Q3 2026, an increase of 20% over Q2 2026 and a 6% decrease over Q3 2025.
- NCR saw approx. 13,765 units sold in Q3 2026, an increase of 3% over the last quarter (Q2 2026) and a 1% decline on yearly basis.
- Hyderabad saw approx. 12,970 units sold in Q3 2026, increasing by 15% each on both quarterly and yearly basis.
- Kolkata saw approx. 3,980 units sold in Q3 2026, increasing by 3% over the previous quarter and marginally declining by 4% over the corresponding quarter in 2025
- Chennai saw approx. 5,395 units sold during the quarter – increasing by 5% quarterly and declining by 10% annually
Available Inventory
Available inventory across the top 7 cities collectively increased by 12% on a yearly basis, standing at approx. 6,30,590 units by Q3 2026-end. Back in Q3 2025, available inventory stood at around approx. 5,61,760 units, while in Q2 2026 it stood at approx. 6,16,500 units.
Price Movements
The average residential property price across the top 7 cities collectively witnessed single-digit annual growth of 7% – from INR 9,105 per sq ft in Q3 2025 to INR 9,714 per sq ft in Q3 2026. Among the top 7 cities, NCR saw the highest annual jump of 12% in its average price. On a quarterly basis, average prices in the top 7 cities rose by just 1%.