

Highest Dividend Yield: A Guide to Identifying and Analyzing Dividend Stocks in India
Highest Dividend Yield
Highest Dividend Yield Shares: Why Yield Alone Is Not Enough
The stock with a high yield may appear to be an enticing option on the surface. When a company is paying out a sizable portion of its cash flow to shareholders, the dividend may become an integral piece of the investment-return puzzle.
The issue is that dividend yield on its own is a poor indicator of performance.
Large dividend payouts will tend to create a high yield, but this can also occur because the company’s share price has fallen. Likewise, a firm that through October 2026 is paying out an outsized dividend when its earnings, cash flow or business fundamentals are deteriorating.
This is why searching for highest dividend yield shares goes well beyond just ranking companies by a single percentage.
The Highest Dividend Yield Shares Screener screen is a good case for multi-factority. The present screen is by its own description a list of stocks that have been regular dividend payers and therefore includes some more recent metrics such as the following: current share price, P/E, market cap, dividend yield, quarterly earnings per share (eps), sales growth (long term), return on capital employed (roce), payout ratio and 3 year eps variation. Currently, on the page data checked for this article there were 123 results over five pages.
More importantly, its underlying query is not as simple as the dividend yield. And it fuses together dividend yield and payment, profit growth over time (spanning the last 10 years), dividends that came before & affects of profitability in recent years.
That gives you a good way to start thinking about how dividend stocks can be more systematically researched.
What Are Highest Dividend Yield Shares?
Highest dividend yield shares are stocks that provide a relatively high annual dividend compared with their current market price.
Dividend yield is generally calculated as:
Dividend Yield = Annual Dividend Per Share ÷ Current Share Price × 100
For example, suppose a company pays an annual dividend of ₹10 per share and its current market price is ₹200.
The dividend yield would be:
₹10 ÷ ₹200 × 100 = 5%
Now suppose the company’s dividend remains ₹10, but its share price falls from ₹200 to ₹100.
The calculated dividend yield becomes:
₹10 ÷ ₹100 × 100 = 10%
Nothing changed in the dividend itself. The yield increased because the market price declined.
This is one of the most important concepts to understand when researching high dividend yield stocks.
A high yield can represent attractive income, but it can also be a signal that the market price has fallen substantially.
SEBI’s investor education material also emphasizes that companies may distribute profits through dividends, but dividend amounts and payment frequency are not guaranteed.
Why Do Investors Look at Dividend Yield?
Dividends represent one way companies return capital to shareholders.
Some businesses distribute a portion of their profits because they have established operations and do not need to reinvest all available cash into expansion. Other companies retain more earnings because they have significant investment opportunities.
Dividend-paying companies can therefore have very different business models.
Investors researching dividend stocks may be interested in:
- current income
- historical dividend consistency
- dividend growth
- earnings stability
- cash generation
- capital allocation
- overall shareholder returns
However, dividend yield should be viewed as one financial metric rather than a complete investment thesis.
A company yielding 8% is not automatically more attractive than a company yielding 4%.
The underlying businesses, valuations, earnings, cash flows and future dividend capacity can be very different.
How Does a Dividend Stock Screener Work?
A stock screener allows investors to narrow a large universe of companies using predefined financial conditions.
Instead of manually reviewing thousands of listed companies, an investor can begin with criteria such as:
- dividend yield
- payout ratio
- profit growth
- market capitalization
- P/E ratio
- ROCE
- dividend history
The Screener page used as the reference for this article is particularly useful because its query combines several conditions.
The current query requires:
- dividend yield above 2%
- dividend payout below 100%
- profit growth above 10% over at least one of the 3-, 5- or 7-year periods
- positive five-year average dividend
- last year’s dividend above the five-year average dividend
- current profit after tax above 80% of the previous year’s net profit
- last year’s dividend above ₹0.35
The screen also specifies companies with June 2026 results.
This illustrates an important principle:
A useful dividend screen can combine income, profitability and historical performance rather than relying on dividend yield alone.
The filters themselves should not be interpreted as a universal investment formula. Different investors can use different thresholds depending on their objectives and the industries being analyzed.
Key Metrics to Evaluate Highest Dividend Yield Shares
Dividend yield is the obvious starting point, but several additional metrics can provide important context.
1. Dividend Yield
Dividend yield measures the annual dividend relative to the current share price.
It is useful for comparing the current cash distribution of companies, but it has a major limitation: the denominator is the market price.
If the share price changes substantially, the yield changes even when the company’s dividend does not.
Therefore, whenever a stock shows an unusually high yield, ask:
- Has the dividend increased?
- Has the share price fallen?
- Was there a special dividend?
- Has the company’s earnings performance changed?
- Is the dividend recurring?
These questions help explain why the yield is high.
2. Dividend Payout Ratio
The payout ratio indicates how much of a company’s earnings are distributed as dividends.
A simplified formula is:
Dividend Payout Ratio = Dividend Per Share ÷ Earnings Per Share × 100
For example, if a company earns ₹20 per share and distributes ₹8 as dividend, its payout ratio is approximately 40%.
A payout ratio can help answer an important question:
How much of the company’s earnings is being returned to shareholders?
A very high payout ratio may deserve additional examination because the company has less earnings retained for reinvestment, debt reduction or protection against weaker periods.
However, there is no single payout ratio that is appropriate for every business.
Capital requirements, business maturity, cash flows and industry characteristics all matter.
The reference Screener screen uses a payout ratio below 100% as one of its filters.
That should be understood as a screening condition, not a universal definition of dividend quality.
3. Dividend History
The latest dividend is only one data point.
A better research process looks at dividend payments over several years.
Questions to examine include:
- Has the company paid dividends consistently?
- Has the dividend increased over time?
- Has the company reduced dividends?
- Were some payments unusually large?
- Was a special dividend involved?
- Does the dividend appear aligned with earnings?
The reference screen itself uses historical dividend information, including the five-year average dividend and a condition comparing the latest dividend with that historical average.
Historical consistency does not guarantee future dividends, but it can provide useful context about a company’s capital-allocation behavior.
4. Profit Growth
Dividends ultimately depend on the economics of the underlying business.
If earnings grow over time, the company may have greater capacity to maintain or increase distributions, assuming cash generation and other financial conditions remain supportive.
The Screener query uses profit-growth conditions across multiple periods:
- 3 years
- 5 years
- 7 years
It requires profit growth above 10% over at least one of those periods.
This is useful because it prevents the screen from focusing entirely on the latest dividend figure.
However, historical profit growth should not be treated as a guarantee of future growth.
5. Quarterly Profit Growth
Long-term profitability is important, but recent financial performance can also change the interpretation of a dividend stock.
The current Screener results include:
- latest quarterly net profit
- quarterly profit variation
- quarterly sales
- quarterly sales variation
These metrics can help identify whether recent operating performance is strengthening or weakening.
For example, a company may have strong historical profit growth but experience a significant recent slowdown.
Conversely, a company with moderate long-term growth may be experiencing improving recent performance.
The correct interpretation depends on the company’s industry and business cycle.
6. ROCE
Return on Capital Employed (ROCE) is a profitability and capital-efficiency measure.
It can help investors understand how effectively a business generates operating returns from the capital employed in the business.
The current Screener screen includes ROCE alongside dividend yield and payout ratio.
This is useful because dividend analysis should not be separated from business economics.
A company that generates strong returns from its operating capital may have a different financial profile from a company that produces weak returns, even if both currently offer similar dividend yields.
ROCE should still be interpreted in the context of:
- industry structure
- capital intensity
- accounting characteristics
- business cycle
- historical trends
7. P/E Ratio
The price-to-earnings ratio, or P/E, compares a company’s market price with its earnings.
It is primarily a valuation metric rather than a dividend metric.
That distinction matters.
Two companies could have similar dividend yields but very different P/E ratios.
A high dividend yield does not automatically mean a stock is inexpensive, just as a low dividend yield does not automatically mean it is expensive.
P/E should therefore be considered alongside:
- earnings growth
- profitability
- business quality
- debt
- cash flow
- dividend sustainability
The reference Screener page includes P/E as one of its displayed columns.
8. Market Capitalization
Market capitalization represents the market value of a company’s outstanding equity.
It provides a useful way to categorize companies by size.
Dividend-paying companies can be found across different market-cap segments.
Instead of assuming that larger companies are automatically better dividend investments, investors can use market capitalization to understand the type and scale of business being analyzed.
The current Screener screen includes market capitalization as part of its results.
Why Can a Stock Have a Very High Dividend Yield?
An unusually high dividend yield should prompt further investigation.
There are several possible explanations.
The company increased its dividend
A genuine increase in the annual dividend can raise the yield.
The share price declined
This is one of the most important possibilities.
If the dividend remains unchanged but the market price falls, the mathematical yield increases.
A special dividend was paid
A company may distribute an exceptional amount of cash that does not represent its normal recurring dividend.
Earnings were unusually strong
Some businesses have cyclical earnings. A strong year can create the capacity for a larger distribution.
The market expects deterioration
A declining share price can sometimes reflect concerns about future earnings, industry conditions or the company’s financial position.
This is why an unusually high yield should be treated as an investigation signal, not an automatic positive.
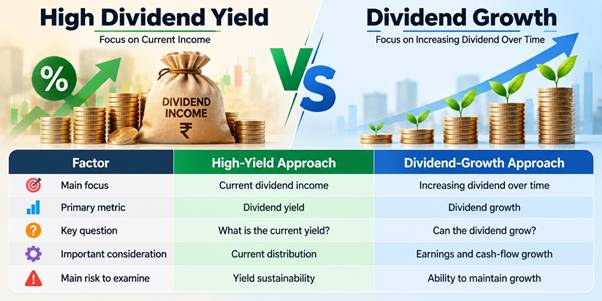
High Dividend Yield vs Dividend Growth
Dividend investing can focus on different characteristics.
| Factor | High-Yield Approach | Dividend-Growth Approach |
| Main focus | Current dividend income | Increasing dividend over time |
| Primary metric | Dividend yield | Dividend growth |
| Key question | What is the current yield? | Can the dividend grow? |
| Important consideration | Current distribution | Earnings and cash-flow growth |
| Main risk to examine | Yield sustainability | Ability to maintain growth |
Neither approach should be considered universally suitable.
A company with a relatively high current yield may have limited dividend growth.
Another company may have a lower current yield but a longer history of increasing distributions.
The appropriate framework depends on the investor’s objectives and circumstances.
How to Evaluate Dividend Sustainability
A sustainable dividend generally requires more than accounting profit.
A practical research framework is:
Earnings → Cash Generation → Capital Requirements → Dividend
Start by asking whether the company generates recurring profits.
Then examine operating cash flow and free cash flow.
After that, consider:
- debt obligations
- interest costs
- capital expenditure
- working-capital requirements
- acquisitions
- future expansion plans
Finally, examine how much cash is being distributed to shareholders.
This helps answer a more meaningful question:
Can the business continue distributing dividends without weakening its ability to operate and invest?
The answer cannot be established from dividend yield alone.
A Simple Example: Why Yield Needs Context
Consider two hypothetical companies.
| Metric | Company A | Company B |
| Dividend Yield | 8% | 4% |
| Payout Ratio | 95% | 50% |
| Profit Growth | Weak | Consistent |
| Debt | Increasing | Moderate |
| Cash Flow | Volatile | Stable |
| Dividend History | Irregular | Consistent |
Company A has the higher current yield.
But the table demonstrates why yield cannot be evaluated in isolation.
Company B has a lower current yield but a different financial profile.
The purpose of the example is not to identify one company as superior. It demonstrates how multiple metrics can change the interpretation of the same headline dividend number.
What Does the Screener Highest Dividend Yield Screen Tell You?
The current Screener page is particularly useful as a starting point for research.
It currently shows 123 results and presents financial information including:
- CMP
- P/E
- market capitalization
- dividend yield
- quarterly net profit
- quarterly profit variation
- quarterly sales
- quarterly sales variation
- ROCE
- payout ratio
- three-year profit variation.
The underlying question also takes into account historical dividend and profit-growth conditions.
So you get the first page with, for instance, Ent. Network, Glaxosmi. Major loser: Pharma, Can Fin Homes, HCL Tech VTM Sharda Cropchem SKP Securities Bimetal Bearings Happiest Minds Bosch Home Comfort.- 3 Their metrics on display vary significantly with respect to valuation or profitability as well payout and growth measures.
While that variation is one reason why you can’t just copy the list and sort it by dividend yield for real research.
A Practical Process for Researching Dividend Stocks
A disciplined workflow can make a dividend-stock screen more useful.
Step 1: Start with the dividend yield
Use dividend yield to identify companies that meet your initial research criteria.
Do not make a decision at this stage.
Step 2: Check dividend history
Look at several years of dividend payments.
Ask whether the latest dividend is representative.
Step 3: Examine payout ratio
Determine how much of earnings are being distributed.
Step 4: Review profit growth
Look beyond one quarter.
Examine longer-term earnings trends.
Step 5: Review recent results
Check the latest quarterly sales and profit numbers.
Step 6: Examine ROCE
Understand how efficiently the company uses capital.
Step 7: Study valuation
Look at P/E and other appropriate valuation metrics.
Step 8: Check cash flow
Determine whether reported earnings are translating into cash generation.
Step 9: Check debt
Review the balance sheet and financing obligations.
Step 10: Read company disclosures
Annual reports, financial statements, exchange filings and corporate announcements can provide information that a screen cannot capture.
Common Mistakes When Looking for High Dividend Yield Stocks
Mistake 1: Choosing the Highest Yield Automatically
The highest yield is not necessarily the most sustainable.
Mistake 2: Ignoring the Share Price
Yield can rise because the stock price has fallen.
Mistake 3: Ignoring Payout Ratio
A high dividend relative to earnings may require closer examination.
Mistake 4: Looking Only at the Latest Dividend
One year’s distribution does not establish a long-term pattern.
Mistake 5: Ignoring Cash Flow
Accounting profit and available cash are not identical concepts.
Mistake 6: Ignoring Debt
Interest and repayment obligations can affect how much cash remains available.
Mistake 7: Ignoring Business Cycles
Commodity, industrial, financial and other cyclical businesses can experience significant changes in earnings.
Mistake 8: Confusing Dividend Income With Total Return
Dividend income is only one component of shareholder return.
Dividend Income vs Total Return
Suppose an investor buys a stock at ₹500.
During the year:
- the stock rises to ₹540
- the investor receives ₹20 in dividends
Ignoring taxes and transaction costs, the components of return are:
Capital appreciation = ₹40
Dividend income = ₹20
Total return = ₹60
That represents approximately 12% on the original ₹500 investment.
Now consider the opposite scenario.
The investor receives ₹20 in dividends, but the share price falls from ₹500 to ₹400.
The dividend income does not eliminate the capital loss.
This illustrates why investors should distinguish between:
- dividend yield
- dividend income
- capital appreciation
- total return
A dividend strategy should be evaluated using the complete financial picture rather than the yield percentage alone.
How to Build a Dividend Stock Screen
A stock screener can be customized according to the research objective.
For example, an investor might begin with conditions involving:
- minimum dividend yield
- maximum payout ratio
- minimum profit growth
- minimum ROCE
- minimum market capitalization
However, thresholds should not be treated as universal rules.
A 20% ROCE may have different implications across different industries.
Similarly, a 70% payout ratio may be sustainable for one business and difficult to maintain for another.
The reference Screener screen provides an example of this multi-condition approach by combining dividend, payout, historical profit growth and dividend-history filters.
The key benefit of screening is efficiency.
The key limitation is that a screen cannot fully understand a business.
What a Stock Screener Cannot Tell You
Even a detailed stock screen has limitations.
A screen may not fully capture:
- management quality
- competitive advantage
- regulatory changes
- customer concentration
- technological disruption
- contingent liabilities
- industry-specific risks
- corporate governance
- future capital expenditure
- strategic changes
- qualitative business developments
That is why a stock screen should normally be viewed as the first stage of research.
After identifying companies, investors can move to financial statements, annual reports, exchange disclosures and other primary sources.
SEBI’s investor education resources similarly encourage investors to conduct independent research rather than blindly following tips or claims of guaranteed returns.
Tax Considerations for Dividend Income
For investors in India, dividend income comes with tax implications.
So, which of these tax treatments apply to the investor will generally depend on individual circumstances and the relevant assessment year tax regime.
Dividend is one of the sources of income from which individual taxpayers could be required to file a return, subject to the relevant return and exemption limits applicable.
Tax provisions change from time to time; hence investors should rely on the most recent Income Tax Department guidance rather than an older calculation around dividend-tax.
It can also be beneficial to separate out investment decisions in:
gross dividend
and
after-tax dividend income.
How to Research a Dividend-Paying Company Before Investing
A practical checklist can be divided into five areas.
Business
- What does the company sell?
- How does it generate revenue?
- Is demand cyclical?
- What are its competitive advantages?
- What could disrupt the business?
Earnings
- Are profits growing?
- Are margins stable?
- What is the recent quarterly trend?
- Are earnings cyclical?
Dividend
- Is the dividend consistent?
- Is the payout ratio reasonable for the business?
- Has the dividend grown?
- Have dividends been reduced previously?
Balance Sheet
- How much debt does the company have?
- Is interest expense manageable?
- Is cash generation adequate?
- Does the company require significant capital expenditure?
Valuation
- What is the P/E?
- What is the current dividend yield?
- Why is the yield at its current level?
- Has the stock price recently changed significantly?
This approach provides substantially more context than simply searching for the highest percentage.
Frequently Asked Questions
What are the highest dividend yield shares?
Highest dividend yield shares are stocks that have relatively high annual dividend payments compared with their current market prices. The Screener screen referenced in this article is specifically designed to identify companies meeting its dividend and financial criteria and currently displays 123 results.
How is dividend yield calculated?
Dividend yield is generally calculated by dividing the annual dividend per share by the current market price and multiplying the result by 100.
Dividend Yield = Annual Dividend Per Share ÷ Current Share Price × 100
Is a high dividend yield always good?
No. A high yield can result from a large dividend, but it can also occur because the share price has declined. Investors should examine dividend history, earnings, payout ratio, cash flow, debt and business conditions.
Why does dividend yield increase when a stock price falls?
Because the stock price is the denominator in the dividend-yield calculation. If the dividend remains unchanged while the share price falls, the calculated yield increases.
What is the dividend payout ratio?
The payout ratio measures the proportion of earnings distributed as dividends. It provides context about how much of the company’s earnings are being returned to shareholders.
What should I check besides dividend yield?
Important additional metrics can include payout ratio, dividend history, profit growth, cash flow, debt, ROCE, P/E and business quality.
Are high dividend yield stocks suitable for every investor?
Not necessarily. Different investors have different objectives, risk tolerance, time horizons and income requirements. A high dividend yield does not automatically match an investor’s financial objectives.
Is the Screener highest dividend yield list a recommendation?
No. It is a stock-screening tool. The results are based on financial and market data and can change as prices and company results change. The current screen should be treated as a research starting point rather than personalized investment advice.
Final Takeaway
The search for highest dividend yield shares can begin with a simple question:
Which companies are currently offering high dividend yields?
But a better research process asks a more important question:
Why is the yield high, and can the underlying business sustain its dividend?
Dividend yield is useful, but it should be interpreted alongside:
- dividend history
- payout ratio
- profit growth
- quarterly performance
- cash flow
- debt
- ROCE
- P/E
- market capitalization
- business quality
A multi-factor approach is illustrated by the Screener reference page which combines dividend yield with payout, historical profit-growth and dividend-history conditions.
The best utility for a dividend stock screen is to filter the investment universe.
It is able to assist investors in the search of companies worthy of nachforschungen, but it can not be a substitute for the analysis of the financial statements, business foundations, assessment, dangers and future uncertainty.
What can you learn if you are researching dividend-paying shares?
Do not stop at the dividend yield. Understand the business that generates the dividend.