
India office leasing stable in 9M 2026 as GCC demand rises and new supply surges
Office leasing across eight major cities remained broadly unchanged year-on-year, while GCCs’ share rose to 41 per cent and new office supply increased 50 per cent.

Office completions picked up during the first nine months of 2026, with 48.6 million sq ft of new space entering the market, 50 per cent more than the 32.5 million sq ft added in the same period last year. (AI Image)
India’s office leasing market remained stable in the first nine months of 2026, with transactions across eight major cities reaching 66.7 million square feet (sq ft), broadly unchanged from the corresponding period last year. However, the sources of demand are changing, with Global Capability Centres (GCCs), flexible workspace operators and businesses serving the domestic market accounting for a growing share of leasing activity.
According to Knight Frank India’s latest assessment, office leasing stood at 18.7 million sq ft in the July-September quarter, up 5 per cent year-on-year (YoY) and 3 per cent over the previous quarter.
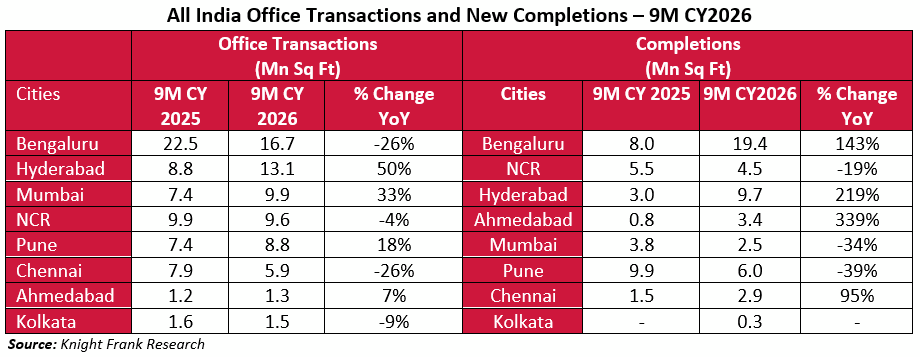
Bengaluru remained the largest office market, recording transactions of 16.7 million sq ft in the January-September period, or 25 per cent of the total across the eight cities. Hyderabad ranked second with 13.1 million sq ft.
Hyderabad was the strongest performer in the third quarter, with leasing reaching 5.6 million sq ft, up 92 per cent from a year earlier. The city accounted for 30 per cent of quarterly transactions across the eight markets, and its leasing volume in the first nine months had already exceeded its full-year total for 2025. Bengaluru and Mumbai each recorded 2.6 million sq ft of leasing in the third quarter.
New office supply rises sharply
Office completions picked up during the first nine months of 2026, with 48.6 million sq ft of new space entering the market, 50 per cent more than the 32.5 million sq ft added in the same period last year.
Bengaluru accounted for 19.4 million sq ft of the new supply, followed by Hyderabad at 9.7 million sq ft. Completions accelerated in the third quarter, reaching 21.5 million sq ft, up 74 per cent from 12.4 million sq ft a year earlier.
The increase in supply pushed the overall vacancy rate to 14.7 per cent in the third quarter, compared with 14.5 per cent a year earlier. At the same time, occupied office stock grew 6.8 per cent YoY to 917.7 million sq ft, indicating that demand continued to expand alongside new supply.
Vacancy trends varied across markets. Hyderabad’s vacancy rate fell by 150 basis points to 11.8 per cent, while Mumbai’s declined by 250 basis points to 15.2 per cent. In the National Capital Region (NCR), the rate rose by 200 basis points to 14.5 per cent as new completions outpaced absorption.
Shishir Baijal, International Partner, Chairman and Managing Director of Knight Frank India, said the market had remained resilient despite geopolitical uncertainty. He pointed to the growing contribution of GCCs, flex operators and India-facing businesses, adding that these segments were helping offset weaker leasing by third-party IT services companies.
GCCs expand their share
GCCs have strengthened their position as a major source of office demand. Their share of total transactions rose to 41 per cent in the January-September period, compared with 37 per cent a year earlier and 31 per cent in 2024.
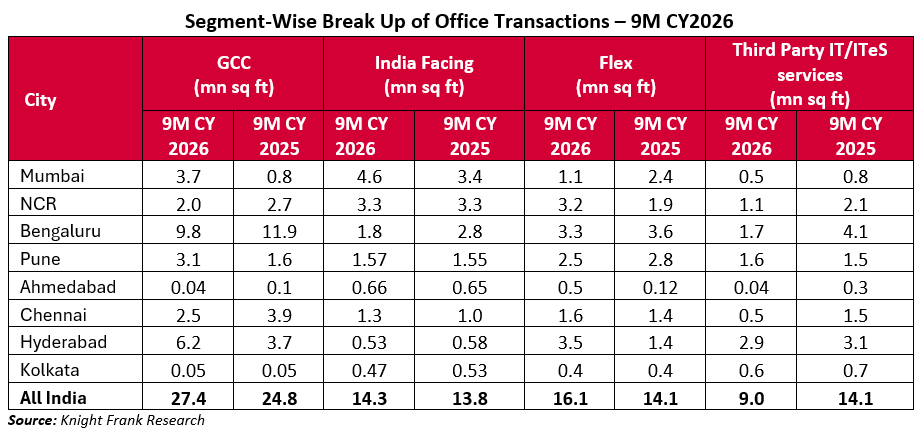
Leasing by GCCs increased 10.4 per cent YoY to 27.4 million sq ft from 24.8 million sq ft in the corresponding period last year. Bengaluru remained the leading destination, accounting for 9.8 million sq ft, or 36 per cent of GCC leasing across the eight markets. Hyderabad recorded an even sharper increase, with GCC transactions rising nearly 70 per cent to 6.2 million sq ft.
GCC leasing across the eight markets rose 19 per cent YoY to 6.8 million sq ft in the third quarter. Hyderabad alone accounted for 42 per cent of this activity.
Flexible workspace operators were another significant contributor, accounting for 16.1 million sq ft, or 24 per cent of total office leasing in the first nine months. This represented a 14 per cent increase from 14.1 million sq ft a year earlier. Hyderabad led this segment with 3.5 million sq ft, followed by Bengaluru at 3.3 million sq ft.
Businesses catering primarily to the Indian market also increased their office footprint. They leased 14.3 million sq ft during the period, accounting for 21 per cent of total transactions, up 3.5 per cent from 13.8 million sq ft a year earlier. Mumbai led this category with 4.6 million sq ft, followed by NCR at 3.3 million sq ft. Together, the two markets accounted for more than half of the segment’s leasing.
Third-party IT services lose ground
The growth in these segments partly offset a decline in leasing by third-party IT and IT-enabled services (ITeS) companies. Their transactions fell 36 per cent YoY to 9 million sq ft in the first nine months, down from 14.1 million sq ft a year earlier. The decline was driven mainly by lower activity in Bengaluru, Chennai and NCR. Hyderabad recorded the highest leasing in this category, at 2.9 million sq ft.
The changing demand mix shows that office leasing is no longer driven mainly by traditional IT services companies. Global capability centres (GCCs), flexible workspace operators and domestic businesses are now contributing a larger share of demand.
Rents rise across all eight markets
Office rents rose across all eight markets in the third quarter, with annual increases ranging from 3 per cent to 13 per cent. Kolkata recorded the sharpest rise at 13 per cent, followed by NCR at 12 per cent and Hyderabad at 9 per cent. Mumbai saw the biggest quarter-on-quarter increase, with rents climbing 4 per cent.
With leasing activity holding steady, occupied office space increasing and rents rising across markets, the sector appears well placed as it heads into the final quarter of 2026. However, how quickly new supply comes on stream and whether demand can keep pace with it will be key factors to watch.