
India revamps wholesale inflation framework, paves way for Producer Price Index era
India has revised its wholesale inflation framework by introducing a new WPI series with a 2022-23 base year and launching Producer Price Indices (PPI), marking a gradual shift towards globally accepted inflation measurement standards as food, fuel and manufacturing costs push wholesale inflation to 9.7%.
In addition to the new WPI series, the Ministry has also released series for Producer Price Indices (PPI). (AI Image)
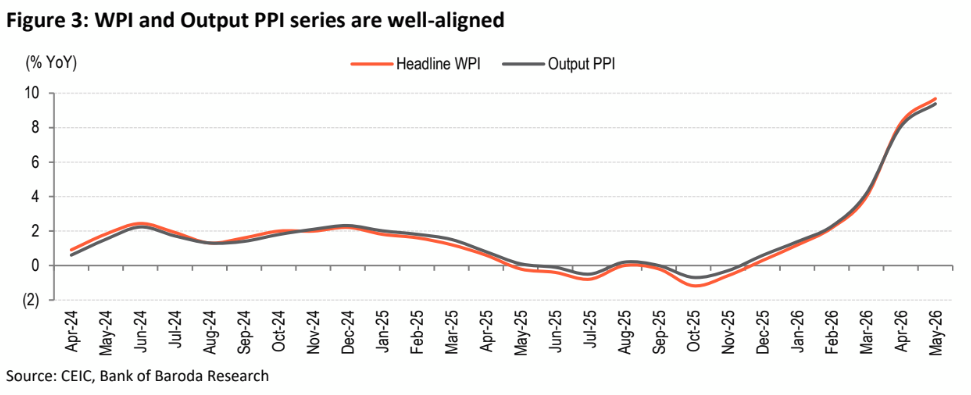
The Ministry of Commerce and Industry has revamped the wholesale inflation series. Apart from revising the base for WPI series from 2011-12 to 2022-23, the Ministry has also provided additional datasets which measure PPIs (output, input and services). The idea is to gradually phase out the WPI series (after 5 years) and adopt PPI as the measure to gauge wholesale inflation, in line with international best practices. For May’26, headline WPI (2022-23=100) has risen to 9.7% from (-) 0.2% in May’25. At the same time, output PPI indicates that headline index rose by 9.4% versus 0.1% last year, according to Bank of Baroda Research’s latest note on India’s revamped wholesale inflation framework and the introduction of Producer Price Indices (PPI).
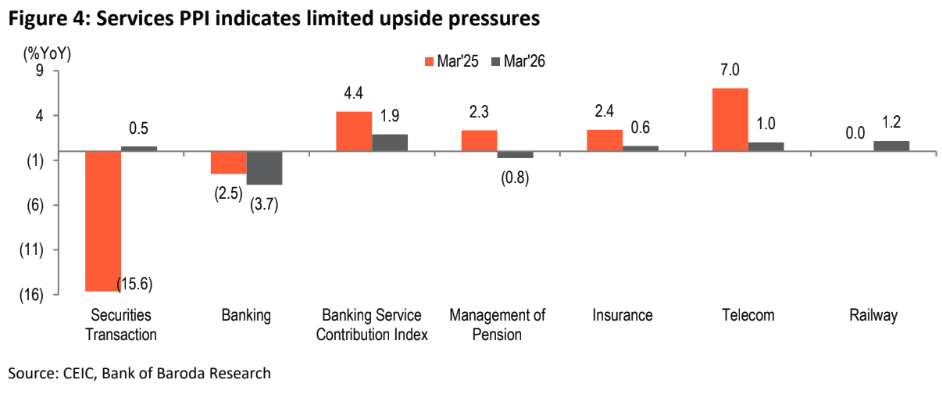
In the latest WPI series, all major group heads (food, fuel and manufactured products) have contributed to the elevated inflation print. Similar trends can be noted in output PPI as well. In contrast, input PPI shows that upside pressure (MoM) was visible in only 8 of the 21 manufactured product indices (food, beverages, textiles, electrical equipment, etc.). Services PPI will be made available on quarterly basis and data for Mar’26 indicates that there was an increase on account of securities transactions and railways, while there was considerable downside pressure on account of banking, insurance, telecom and management of pensions.
What’s New:
• The Ministry of Commerce has released WPI with new base of 2022-23 and has discontinued the series with base year 2011-12.
• For the new the WPI series (2022-23=100):
o Number of items tracked has been increased from 697 to 957.
o Under electricity index, renewable energy has also been added (solar, wind, nuclear).
o Crude petroleum & natural gas index has been shifted from ‘primary articles’ to ‘fuel and power’.
o To determine the new weights of each component, Gross Value of Output (GVO) has been used this time instead of using Net traded Value earlier (GVO + Imports – Exports).
o In case of missing data, now ‘targeted mean imputation’ method will be used instead of ‘carry forward’ method used in the old series.
• In addition to the new WPI series, the Ministry has also released series for Producer Price Indices (PPI).
• Under this, 3 new series will now be made available:
o Output PPI—Monthly basis
o Input PPI—Monthly basis
o Services PPI—Quarterly basis
• The current WPI series (2022-23) will be discontinued after 5 years and only PPI series will be made available after that.
• WPI, Output PPI and Service PPI are being compiled on the basis of Basic Price (which excludes Net Tax and Trade & Transport Margin).
• Input PPI is being compiled using Purchaser’s Price since industries purchase input from market.
New WPI series (2022-23=100)
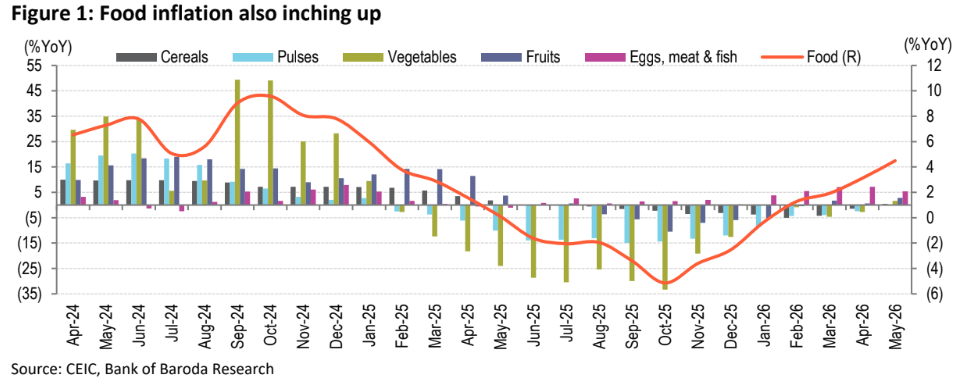
Food inflation comes in higher:
Headline WPI inflation rose to its highest in the current series (since Apr’24) to 9.7% in May’26, up from 8.3% in Apr’26 and (-) 0.2% in May’25. Compared to May’25, food inflation was much higher at 4.5% versus 0.1% last year. This was largely on account of higher inflation recorded in food grains, vegetables, milk, eggs, meat & fish, and condiments & spices. Vegetable inflation rose to 1.6% from (-) 24% last year, due to base effect. Within vegetables, tomato, ginger, cucumber, cabbage and okra added to upside pressures. Milk inflation was up from 2.8% last year to 3.3% this year, and eggs, meat and fish component registered a rise from (-) 1% in May’25 to 5.4%. Amongst the meat items, price index for marine fish, goat meat, eggs, beef & buffalo meat and pork led the rise. Index for condiments was driven up by all sub-heads except for black pepper, cardamom, and tamarind. Foodgrain inflation too rose to 0.4% from (-) 0.3% last year, due to rise in index for paddy, jowar, pulses (all sub-heads excluding gram, peas/chawli, and khesari). Internationally, as per World Bank’s pink sheet data, the trend is different. Wheat prices have increased further by 27.7% in May’26 versus -18% in May’25 and rice prices are up marginally by 2.4% (-31.9% last year).
Fuel and power inflation jumps sharply:
Fuel and power inflation rose to highest in the series, noting the impact of inclusion of crude
petroleum and natural gas in this index. It rose by 30.3% in May’26, up from 24.9% in Apr’26 and (-)
5.5% last year (May’25). Compared to the previous year, inflation index for mineral oil segment (49.8%
versus -7.5%) and crude petroleum & natural gas (61.5% versus -15.5%) registered most significant
increase. Within this, index for crude petroleum jumped by 85% (-20.1% last year) and that of natural
gas rose by 30.1% (-8.4%). Internationally, crude oil prices rose sharply in YoY terms in May’26 by 62%
compared with (-) 22.9% decline last year during the same period, as geopolitical tension in the Middle
East remained escalated at that time. In addition to this, depreciating rupee also impacts import
prices. Amongst mineral oils, all sub-heads inched up, with maximum increase noted for items like
ATF, MTO, Naphtha, Furnace oil, and LPG.
In contrast, index for coal (-2.3% versus -1.1%) and electricity (-1.8% versus -0.5%) fell at a faster pace in May’26 versus May’25. Within coal, both coking and non-coking coal index declined more than last year, while index lignite coal registered an increase. Under electricity, the decline was driven by thermal coal electricity and wind electricity, while all other sub-components recorded rise in index.
In Jun’26 so far, following the peace agreement between US and Iran, international oil prices have fallen significantly, as they are down by more than 8% (from 11 June 2026) to hover ~US$ 83/bbl. Oil prices can fall even lower depending upon the longevity of this deal and this in turn will ease pressure on fuel & power inflation in the coming months.
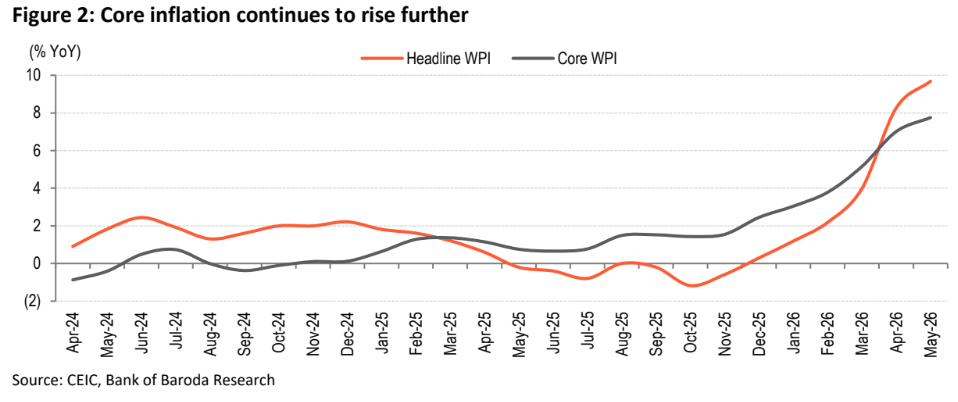
Core WPI inches further up:
Core inflation is also at highest in the current series at 7.8%, up from 7% in Apr’26 and 0.8% last year (May’25). Manufactured product inflation also rose to 7.5% (highest in the new series), from 1.4% last year (May’25) and 6.7% last month (Apr’26). Of the 22 commodity sub-indices, 20 indices rose at a faster pace in May’26 than May’25 led by—basic metals, chemicals & products, textiles, tobacco products, electrical equipment and furniture. Inflation for key metals shows that index for aluminium semi-finished products rose at faster pace (40.3% versus 2.7%). Lead & alloy price index was up by 4.3% from 4.1% last year. Index for Zinc also jumped notably by 17.1% from (-) 2.2% in May’25.
PPIs
Headline output PPI rose by 9.4% compared with 0.1% in May’25. Amongst the food items, inflation was driven by higher index for paddy (1.9%), Arhar (2.9% versus -21.5%), groundnut (21.2% versus – 9%), rubber, citrus fruits, tomato, cabbage, spices, milk, wool, eggs and meat products, and marine products.
PPI for mining of metal ores also rose considerably from 14.6% in May’25 to 21.5% in May’26, led by index for copper (17.6% in May’26 versus -4.1% in May’25) and other metallic minerals (52.4% versus 26.9%). Mining index for coal and lignite fell (-2.3% versus 0.3%). Index tracking extraction of crude petroleum jumped by 85% (-20.1% in May’25) and that of extraction of natural gas rose by 30.1% versus 0.2% last year.
Amongst manufactured products, output PPI also shows that upside pressure came from chemicals (organic, inorganic, fertilizers, paints, pesticides); basic metals (non-ferrous and iron & steel); electrical equipment (cables and wires); textiles (textile products, synthetic fibres) and tobacco products.
Input PPI: the trial series for input prices of manufactured products is available from Mar’26 onwards. As a result, on MoM basis, we note that out of index for 21 products, index for only 8 products inched up from Apr’26. These were: food products, beverages, tobacco products, wearing apparels, leather & products, fabricated metal products, electrical equipment and printing and reproduction materials. Index for all other sub-components declined.
Services PPI: This dataset measures wholesale inflation for banking and transportation services. As per data available for Q4FY26, inflation rose for securities transactions (0.5% in Mar’26 versus -15.6% in Mar’25) and railways (1.2% versus 0%), particularly for passenger services. In contrast, most notable decline was visible in case of management of pension, insurance, telecom and banking.